
2026 Mid-Year Update
MFG Happenings
By Michael Macco, CFP®, CIMA®

The Macco Financial Group team.
The first half of 2026 has continued the momentum and evolution we experienced throughout last year. This spring, Ali Janquart graduated and officially joined Macco Financial Group full time. Many of you have already had an opportunity to meet or work with her over the past year. Ali passed the CERTIFIED FINANCIAL PLANNER® competency exam on July 21st. The CFP® exam requires a significant commitment of time and preparation, and we are proud of the work she has put in to reach this point. We have strong confidence in her and look forward to seeing what comes next.
We also welcomed Garrett Staszak as our summer intern. Garrett passed the Securities Industry Essentials® exam on July 15th. He will return to UW–Stevens Point this fall to finish his degree in December. Garrett has been a great addition to the office, and we enjoyed getting to know him and watching him grow professionally.
There has been exciting news outside the office as well. Andrew and Amanda Froelich welcomed their third child, Grant, on June 22nd. Mom and baby are doing well, and we are thrilled for the Froelich family as they adjust to life with three children.
Over the coming months, many of you may see more of Morgan, Ryan, and Ali in meetings and throughout the planning process. Their growing involvement allows us to bring more of the team's knowledge and perspective into each client relationship, while Patrick, Andrew, and I continue in our roles as lead advisors and primary points of contact.
I truly believe we have an exceptional group of people here at Macco Financial Group. They work hard, care deeply about the people we serve, and continue to pursue the level of excellence our clients deserve.
Patrick's Ponderings
By Patrick Stoa, CFP®
Politics
I just visited with Robert Stein, CFA, the Deputy Chief Economist at First Trust, and he started off the conversation with politics. For better or worse, mid-term elections are upon us soon. Historically, the party that does not have the Presidency gains a few seats in Congress or the Senate. Realistically, the only thing this means is that starting in 2027, any bills that are likely to get to the President's desk will have at least some bipartisan compromise in them.
Two items that are forever confusing to me: no major politicians seem concerned that the National Debt continues to rise at a moderate pace, and Social Security will have funding problems around 2034. These aren't going away, so I am sure they will come up in the future.
Economy
Meanwhile, a few major trends are affecting the US economy in interesting ways. In many parts of the country, house prices are stabilizing or even declining. One factor that may be contributing is that it appears we don't need as many new houses because net immigration is neutral or declining, while the birthrate is also more or less neutral. At the same time, productivity per worker is up modestly. In the past, higher productivity meant unemployment could rise as people were let go. But with lowered net immigration, there just aren't as many workers available anyway. Therefore, unemployment has only risen slightly, and at 4.2% is still well below long-term averages. Inflation is still with us, but at a somewhat reduced rate. The Fed seems inclined to keep rates fairly stable for the foreseeable future.
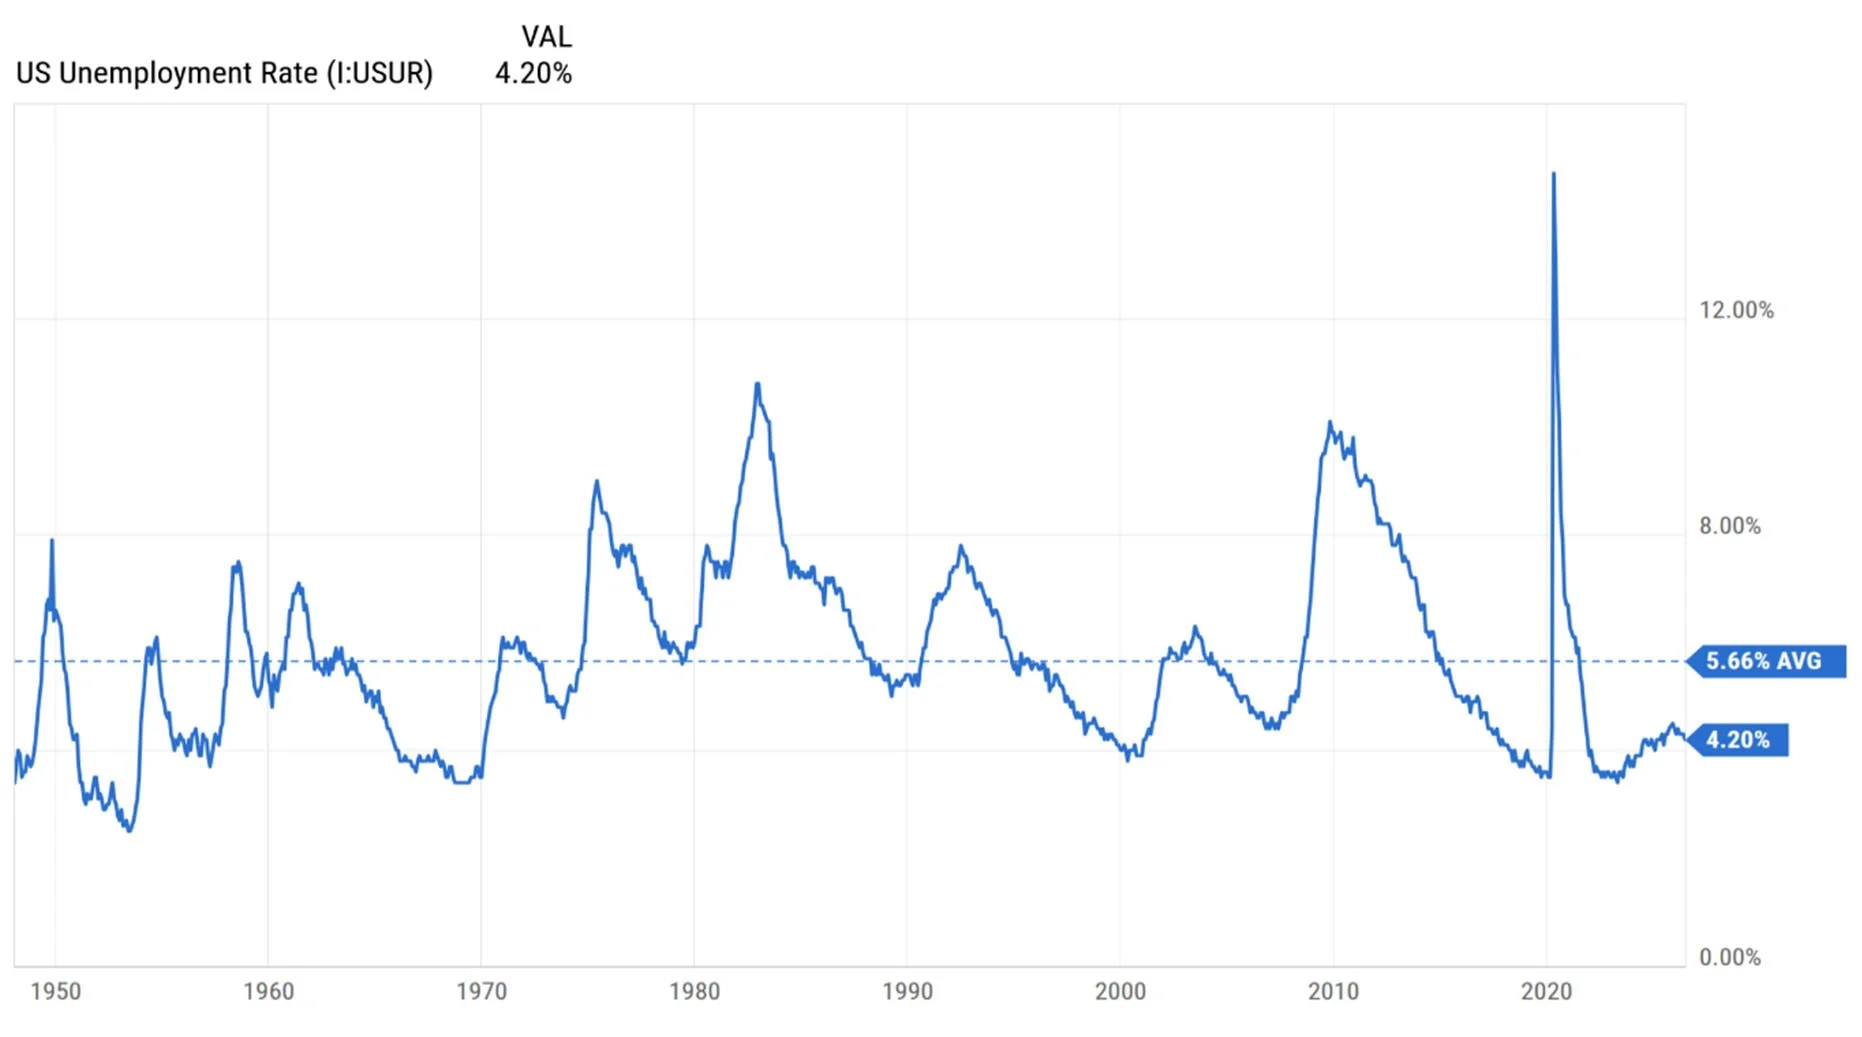
US Unemployment Rate, 1950–present. Source: YCharts.
Market
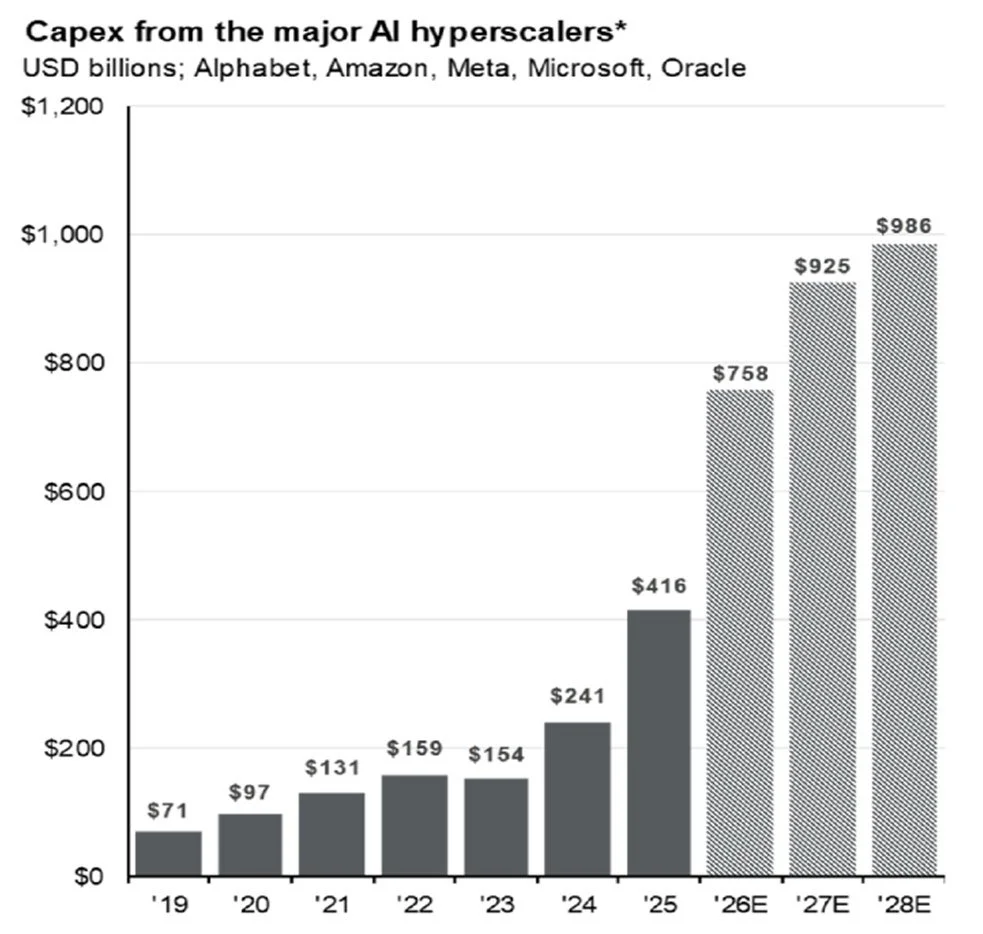
Capex from the major AI hyperscalers (Alphabet, Amazon, Meta, Microsoft, Oracle), USD billions.
It's an open question as to what will happen with the Strait of Hormuz, but the US produces plenty of its own oil. We still import some because we don't have all the right types, but broadly we are not at any major risk due to the situation in Iran. Oil and gas prices have come down from their peaks and are likely to stay reasonable for the foreseeable future. Some other countries such as India and China were much more reliant on Iranian oil, and they are paying the price for that now.
2026 is definitely a year of continued massive AI investment throughout the economy. Several major corporations are spending a few hundred billion dollars on AI chips, datacenters, power, and connective networks. In just a few years they are expected to spend as much as $1 trillion per year!
This theme will play out in unimaginable ways over the next 10–15 years. To give an idea of how far we might go, consider this: September 25th, 1956 — just 70 years ago — was when the first telephone cable reached between North America and Europe. It could handle a maximum of 35 simultaneous calls between the continents, and the cost was about $35 per minute in today's dollars. This seems almost silly in the age of AI. Yet someone will look back at us, 70 years from now, and ponder at our primitiveness.
In the stock market itself, by many measures, valuations could be considered elevated. Overall P/E ratios of the S&P 500 remain on the high side, around 20. The long-term average is around 15–17, depending on what timeframe you pick. Meanwhile, companies are quite profitable. Robert Stein seems to think that if you adjust accounting methods to the same methods commonly used some years ago, the current market would represent a normal, rather than high, valuation. I am a little more pessimistic. Broadly, we have made some investment tweaks so that if a market downturn happens, we hope to absorb a little less of it, particularly in our more conservative portfolios.
MFG Investment Committee Positioning
By Andrew Froelich, CFP®, CIMA®
While we have more clarity about the future than we did in March, there are still many unanswered questions about where capital markets, the US economy, and executive decisions will go from here. The road has been bumpy, and while equity markets continue to drag upwards, we as an investment committee continue to evaluate opportunities to adjust portfolios in response to changing market conditions. Below is a brief overview of the investment management changes from our 2nd quarter Investment Committee Meeting in May.
Streamlined the fixed income portions of our portfolios while simultaneously reducing bond duration. With markets now pointing towards rates staying higher for longer, this shift reduced the maturity length of the bond portion of our portfolios with minimal yield reduction.
Slight rebalance from Large Cap Value to Core/Growth. Value had previously been relatively overweight. This shift realigned models with our longer-term strategic outlook.
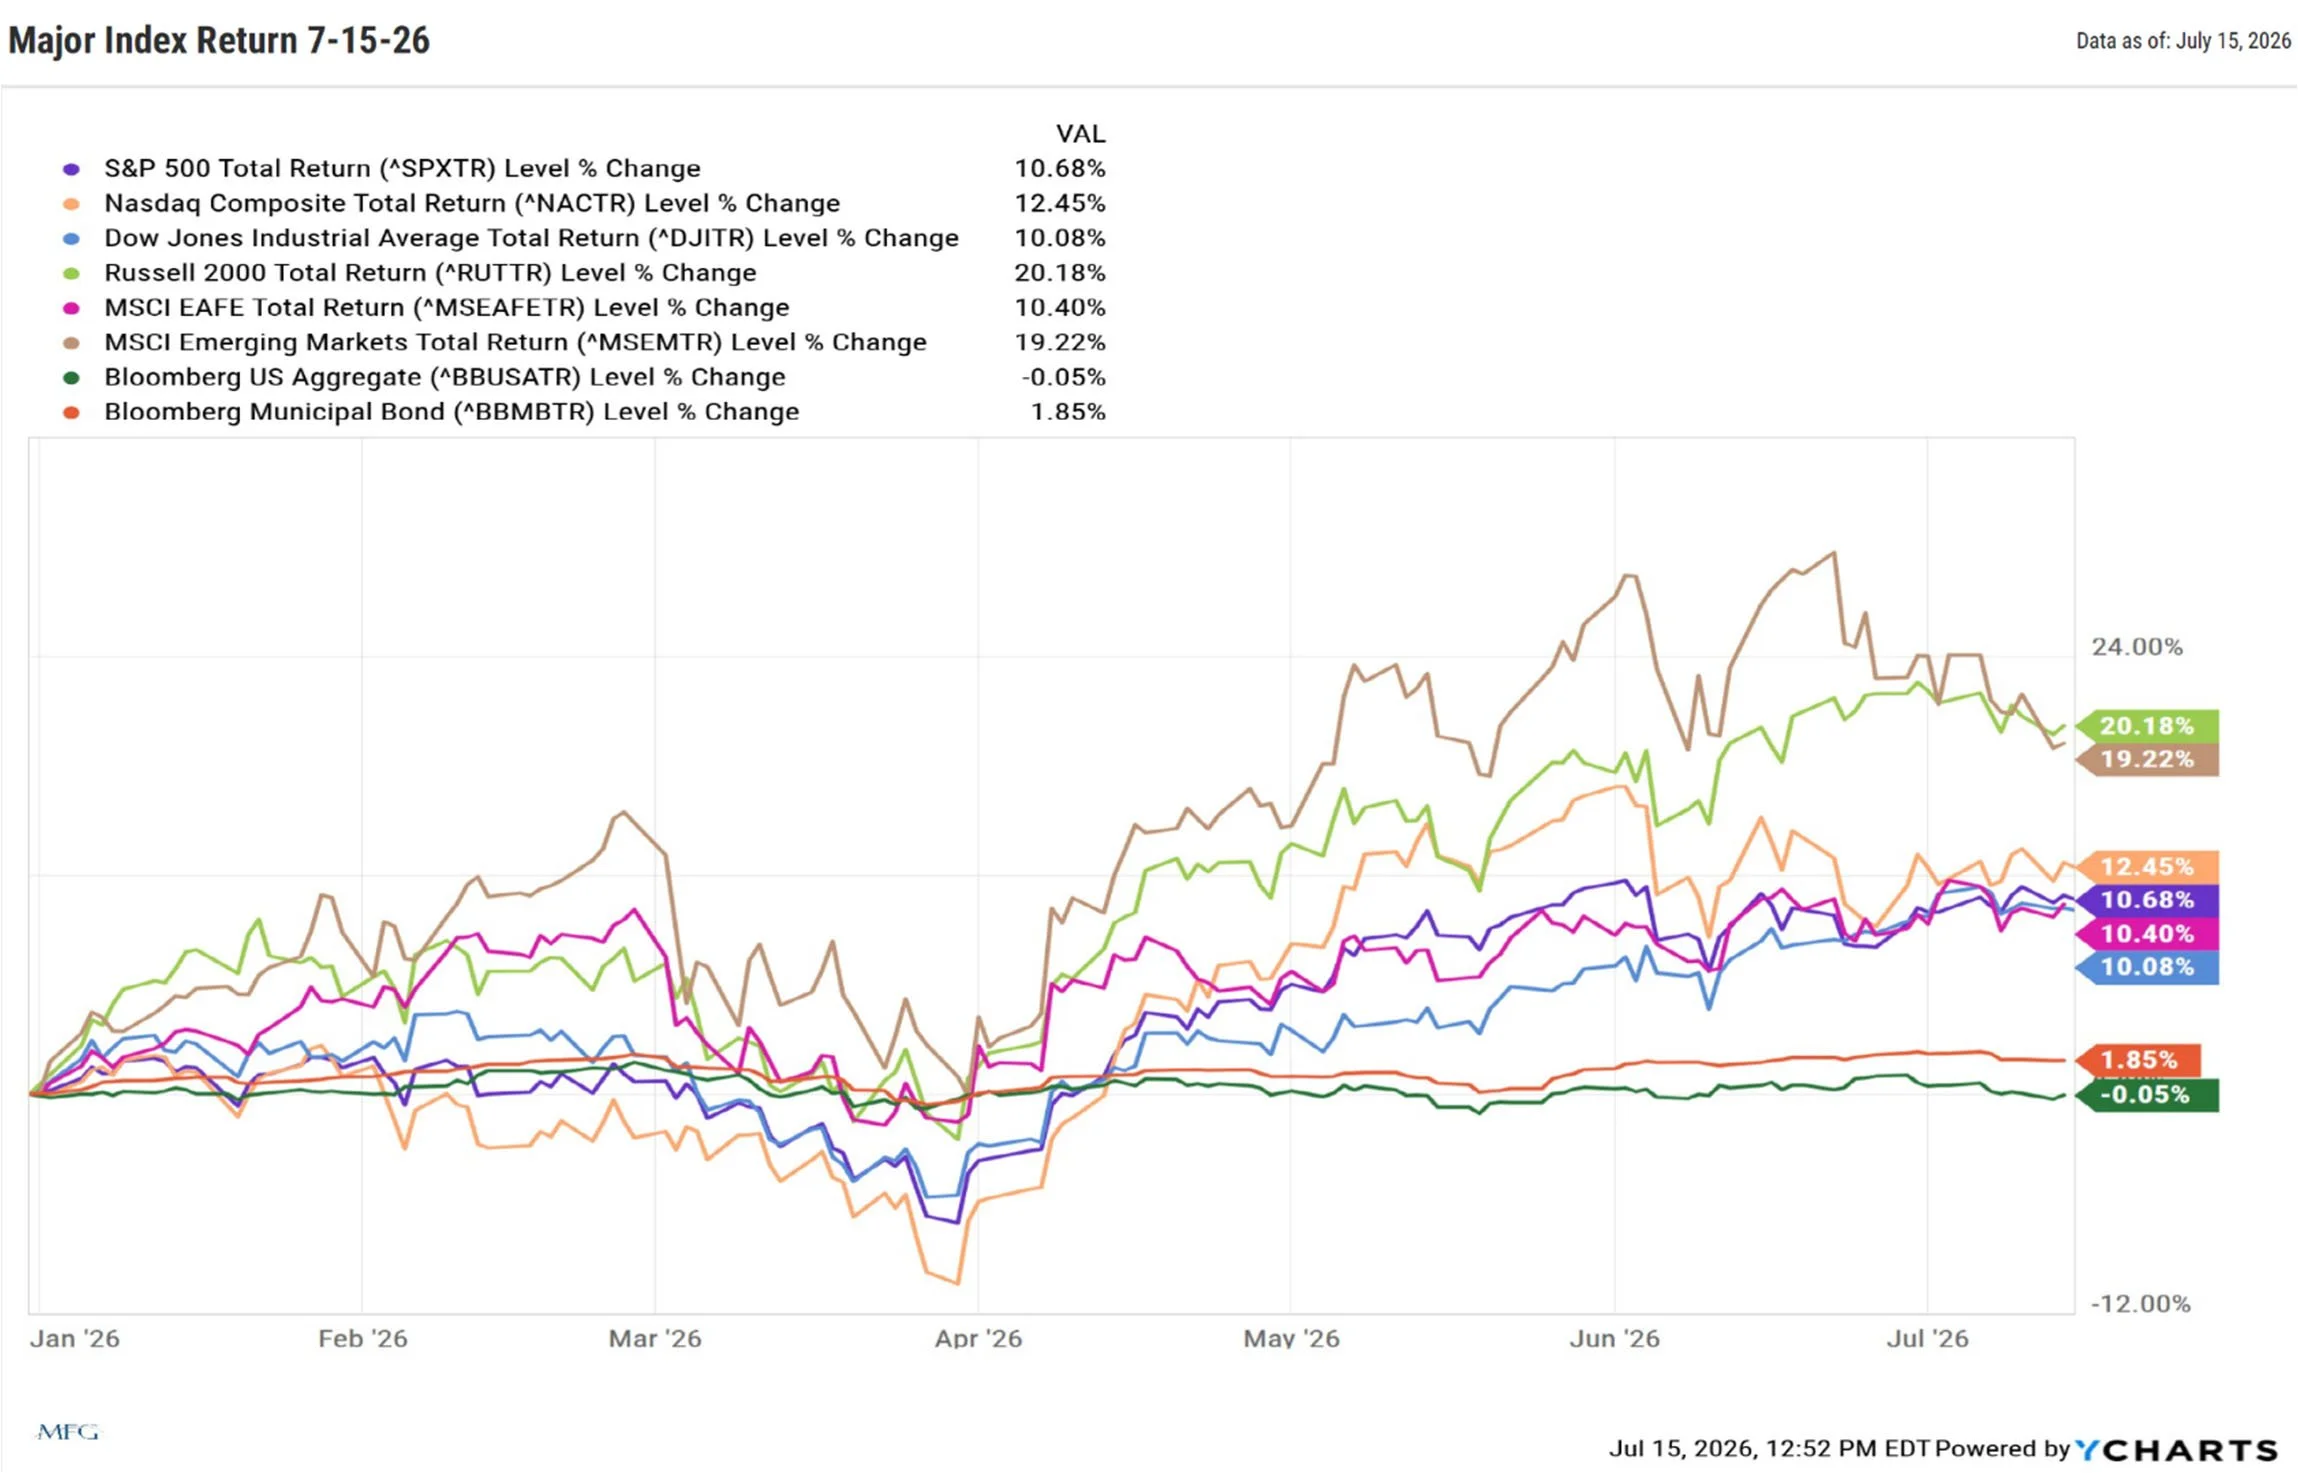
See below for year-to-date major indices performance (as of 7/15/26).
Relevant Topics: Trump Accounts & the ACA Cliff
By Ryan Robillard
Trump Accounts — A New Account Type for Minors
Established under The One Big Beautiful Bill Act (OBBBA), Trump Accounts are designed to give children an early and meaningful start toward retirement savings, while also encouraging broader financial literacy across families.
At their core, Trump Accounts function similarly to traditional IRAs, but with a critical difference — children do not need earned income to participate. This removes one of the biggest barriers that has historically limited saving into a Traditional or Roth IRA for minors and opens the door for parents, grandparents, and even institutions to begin investing on a child's behalf from birth through age 17.
From a planning perspective, the flexibility around contributions is one of the most compelling features. Families can contribute up to $5,000 annually, while employers may add up to $2,500 within that same limit. In addition, government and charitable contributions — such as the $1,000 federal contribution available to eligible children — do not count toward that cap, meaning total annual funding can exceed traditional thresholds. This layered contribution structure creates a powerful opportunity for early accumulation, particularly when paired with a long investment horizon.
Not all contributions are treated the same from a tax standpoint. Family contributions are made on an after-tax basis and establish basis in the account, meaning those dollars are not taxed again when withdrawn. In contrast, employer and government contributions, along with all investment earnings, are considered pre-tax and will be taxable as income upon distribution.
During what is known as the “Growth Period” (birth through age 17), these accounts are designed strictly for accumulation. Investment options are intentionally limited to low-cost, broad U.S. equity index funds, reinforcing a disciplined, long-term approach. Distributions are generally not permitted during this period, ensuring that the focus remains on compounding rather than short-term access.
Once the child reaches age 18, the account transitions into a structure that mirrors a traditional IRA. At that point, standard rules around contributions, distributions, and taxation begin to apply. Because contributions may include both after-tax (family) and pre-tax (government/employer and earnings) dollars, distributions are treated proportionally — meaning a portion may be tax-free, while the remainder could be subject to income tax and potential penalties depending on timing and use.
From a broader planning standpoint, Trump Accounts now join 529 plans and custodial (UTMA) accounts as part of the toolkit for saving on behalf of children. Each serves a different purpose. While 529 plans remain highly effective for education-specific goals — and offer clear gift tax treatment — Trump Accounts stand out for their retirement focus and ability to leverage outside contributions. For families considering both, evaluating them together rather than in isolation may help preserve flexibility as rules continue to evolve.
The real advantage lies in time. Starting an account at birth allows for decades of compounded growth, even with relatively modest contributions. In situations where a child qualifies for government or employer funding, the account may provide meaningful value even if families contribute little or nothing themselves.
As with any new legislation, details remain subject to evolving IRS guidance, and implementation will continue to develop. However, the underlying concept is clear: encouraging earlier engagement with saving and investing can have a meaningful long-term impact.
If you'd like to explore whether a Trump Account fits into your family's financial plan, we encourage you to connect with your advisor to initiate the discussion.
Affordable Care Act — Back to the Norm?
One of the most significant health care planning changes of 2026 has been the expiration of the enhanced Affordable Care Act (ACA) premium tax credits. After several years of expanded subsidies introduced during the pandemic, Congress allowed the provisions to lapse at the end of 2025, returning the ACA marketplace to its pre-COVID framework. As a result, millions of Americans are facing higher health insurance premiums this year.
Most notably, the ACA's “subsidy cliff” has returned. Under the enhanced rules, households could qualify for premium assistance regardless of income, with premiums generally capped at 8.5% of household income. Beginning in 2026, however, individuals and families with income above 400% of the federal poverty level once again lose eligibility for premium tax credits entirely, creating a sharp cutoff where even a small increase in income can result in the loss of thousands of dollars in annual subsidies.
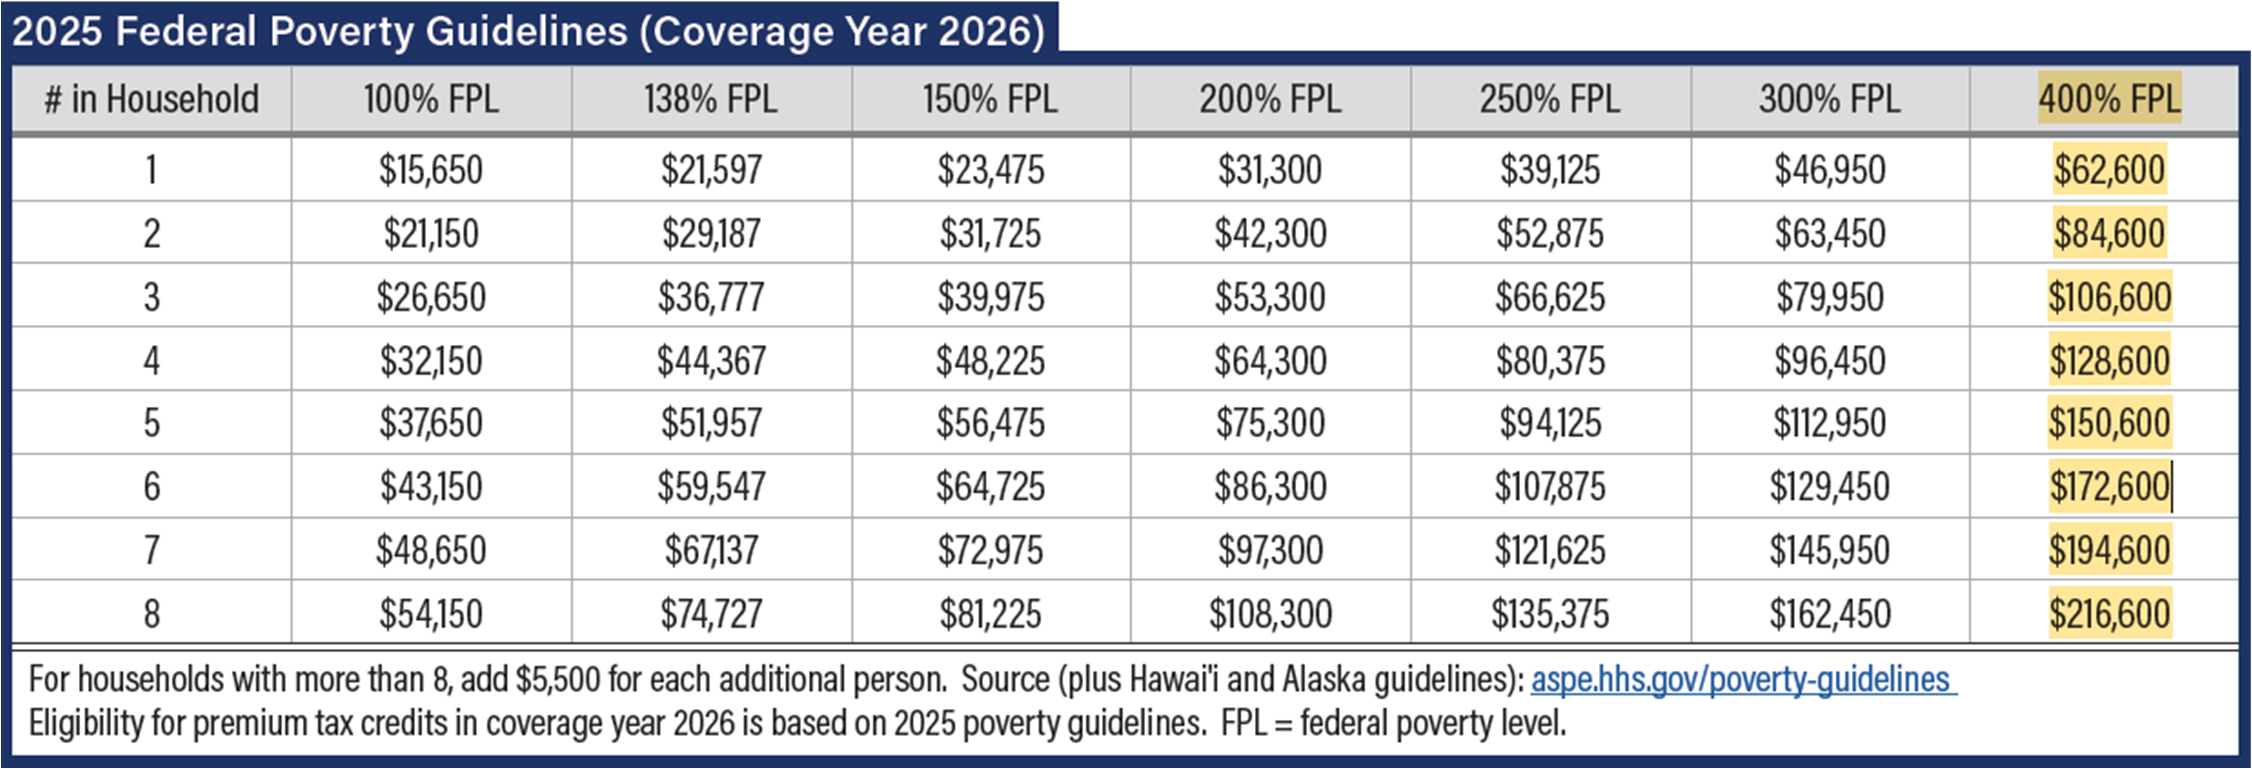
2025 Federal Poverty Guidelines (Coverage Year 2026). Source: Beyond the Basics Reference Chart / aspe.hhs.gov.
For early retirees, self-employed individuals, and pre-Medicare households purchasing coverage through the ACA marketplace, countable income management has become increasingly important. Strategies such as coordinating retirement account withdrawals, Roth conversions, capital gains, and Health Savings Account (HSA) contributions may help households remain below key income thresholds and preserve valuable premium assistance. As health care costs continue to rise, proactive tax planning is once again an essential component of managing overall retirement and household expenses.
The Economy: Where We Stand & What's Next
As we enter the third quarter and the remainder of 2026, there are a few items we are keeping in focus within the US economy.
Inflation & The Fed
The chart below highlights the ongoing tug-of-war between inflation and monetary policy, with recent inflationary pressures — largely driven by the Iran conflict and the associated spike in oil prices — pushing CPI back above the Fed Funds Rate. This dynamic suggests the Fed briefly fell “behind the curve,” meaning policy rates were not restrictive enough to keep inflation in check, a situation that can allow price pressures to become more entrenched and erode the Fed's credibility. However, June inflation data came in lower than expected, showing inflationary easing month-over-month and bringing CPI back slightly below the Fed Funds Rate, at least for now. This sets up a critical decision at the upcoming July 29th FOMC meeting, particularly with new Fed Chair Kevin Walsh leading the discussion. The Fed faces a delicate balancing act: while there may be political pressure from President Trump to continue cutting rates, the recent inflation data may suggest the opposite. Cutting too soon risks reigniting inflation, while holding firm reinforces the Fed's commitment to price stability — making this one of the more consequential meetings in recent memory.
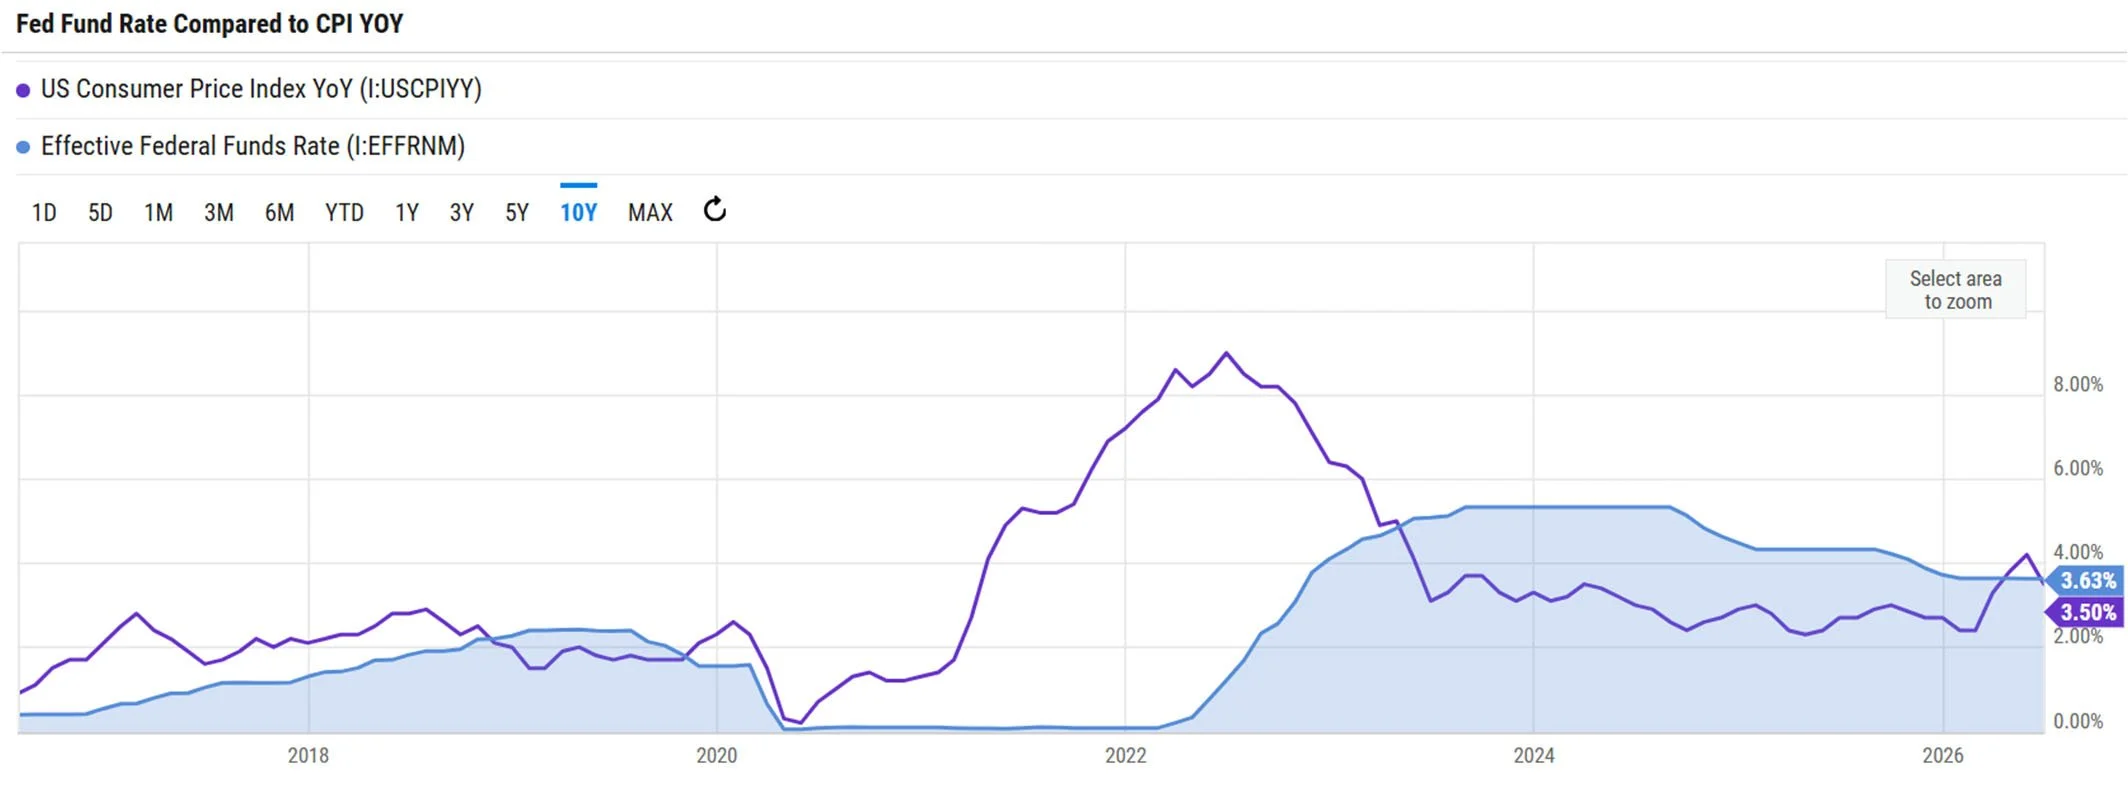
Effective Federal Funds Rate vs. US CPI (year-over-year), 10-year view. Source: YCharts.
Consumer Sentiment
It's hard to overlook consumer sentiment. Consumer sentiment continues to be a persistent concern in the post-COVID economic landscape, with confidence levels struggling to regain sustained momentum and repeatedly setting new lows. Most recently, sentiment fell again in May 2026, marking another weak point in an already fragile trend. Continued declines highlight ongoing consumer uncertainty. Consumer sentiment and spending remain key drivers of economic growth, and prolonged weakness may signal that households are increasingly cautious about their financial outlook. If consumers continue to downgrade their expectations, it could point to potential economic softening ahead. However, if external pressures such as inflation or policy concerns ease, there remains potential for sentiment to recover, as seen in past rebounds.
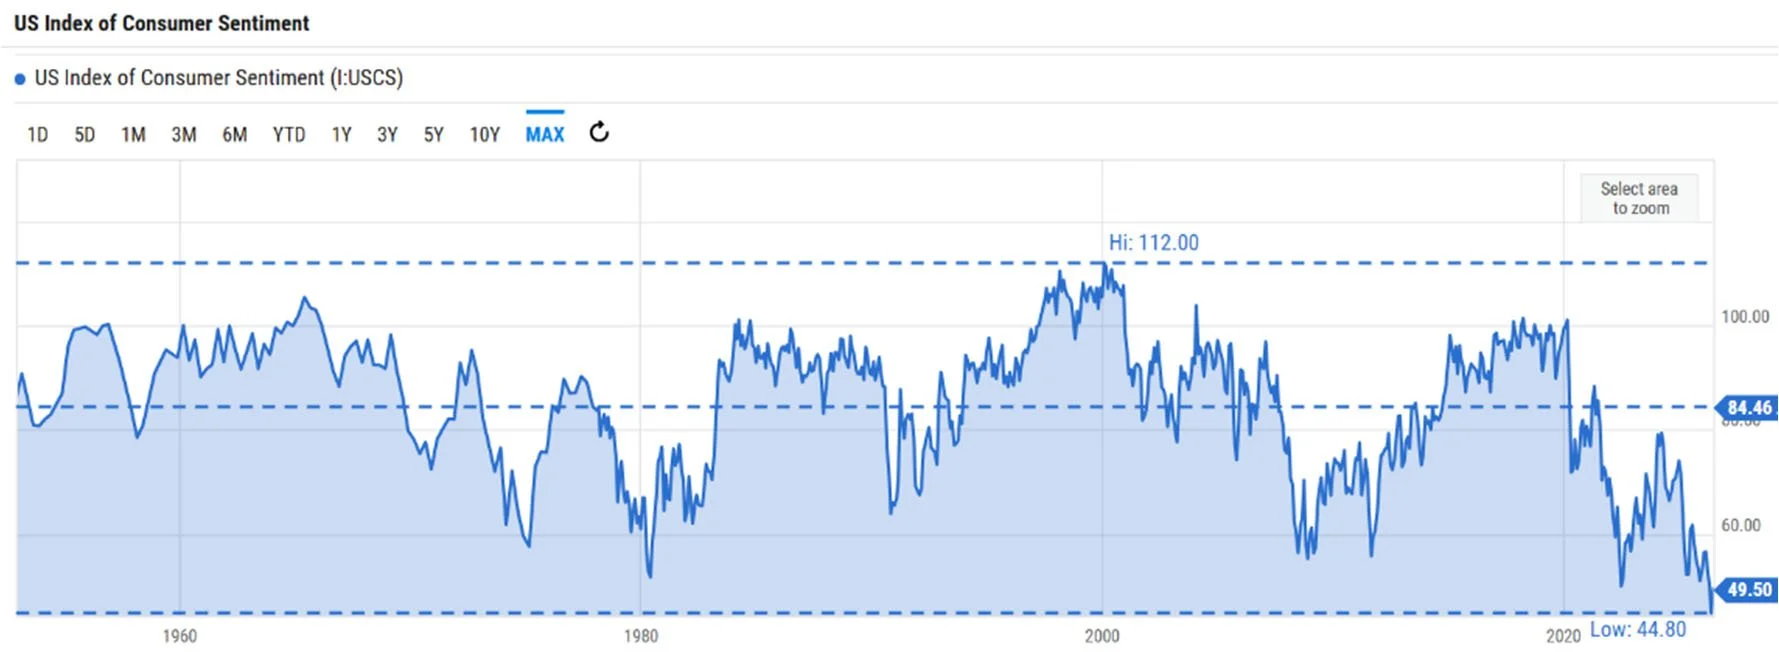
US Index of Consumer Sentiment, long-term view. Source: YCharts.
Real Wage Growth
The real wage growth chart shows how inflation-adjusted earnings have fluctuated over time, with periods of both strength and contraction. Notably, sustained negative real wage growth — where inflation outpaces wage increases — is typically a concerning signal for markets, as it erodes consumers' purchasing power and can lead to reduced spending, ultimately weighing on economic growth. Recently, real wage growth dipped into negative territory for two consecutive months (April & May), raising some concern about consumer resilience. However, it is encouraging to see that June inflation data came in better than expected, helping push real wage growth back into positive territory. This return to the “green” suggests that wage gains are once again outpacing inflation, which is a supportive sign for consumers if the trend continues.
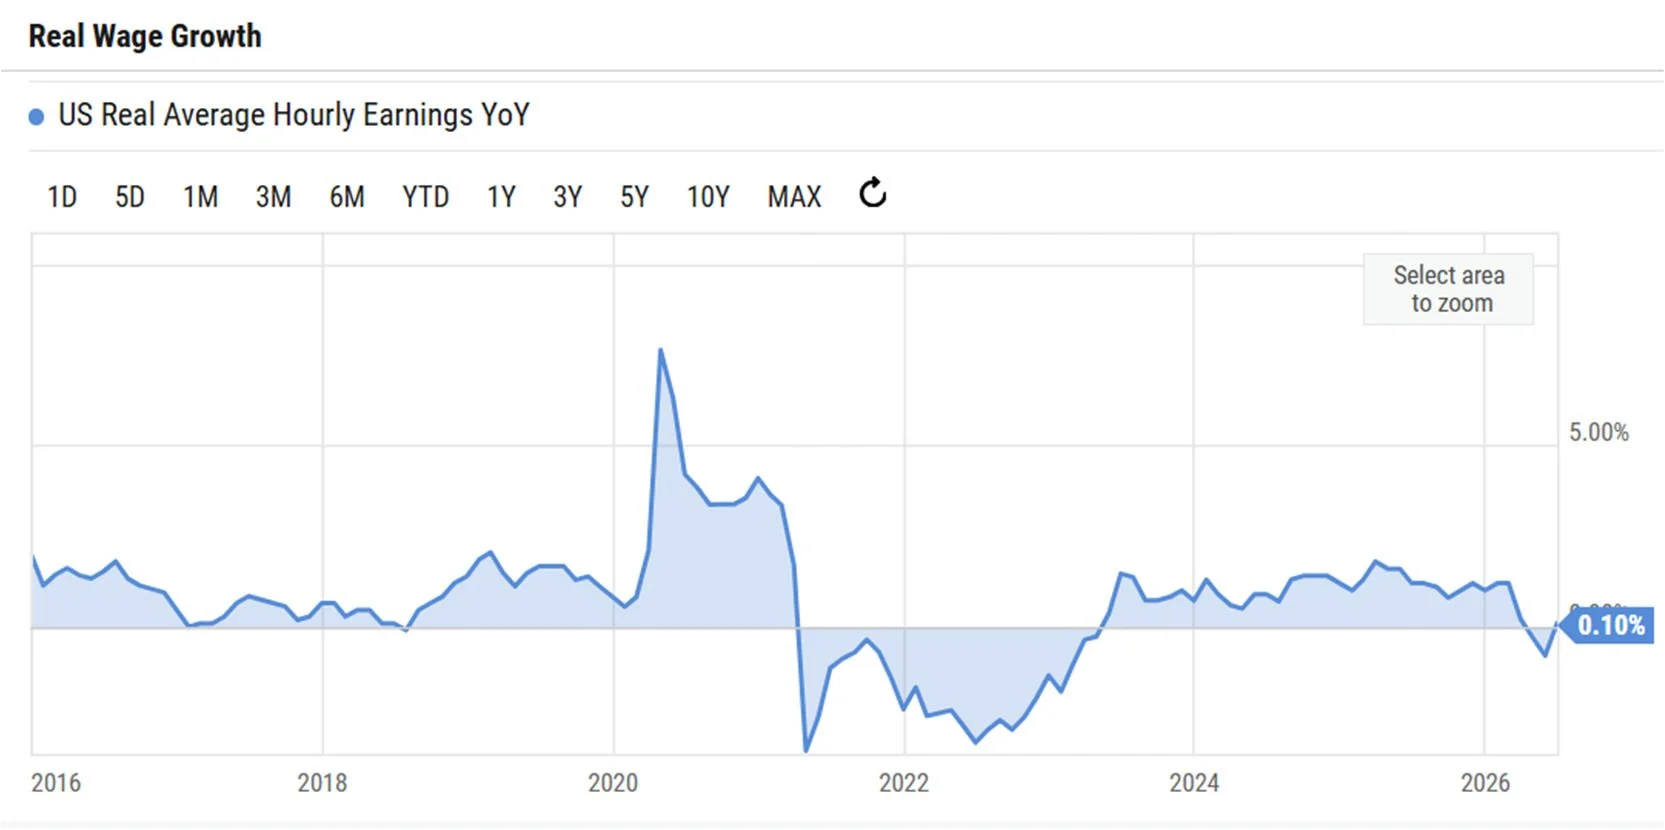
US Real Average Hourly Earnings, year-over-year. Source: YCharts.
US Savings Rate
The U.S. personal savings rate has recently fallen to its lowest level since 2008, signaling that consumers are saving less and spending a larger share of their income. This trend can indicate that households are feeling financial pressure from persistent inflation, higher interest rates, and rising living costs, forcing them to reduce savings in order to maintain their current lifestyles. While strong consumer spending can continue to support short-term economic growth, a declining savings cushion leaves consumers more vulnerable to economic shocks or unexpected expenses. If this pattern persists, it may point to weakening financial resilience among households and could eventually slow future spending, particularly if labor market conditions soften or borrowing becomes more expensive.
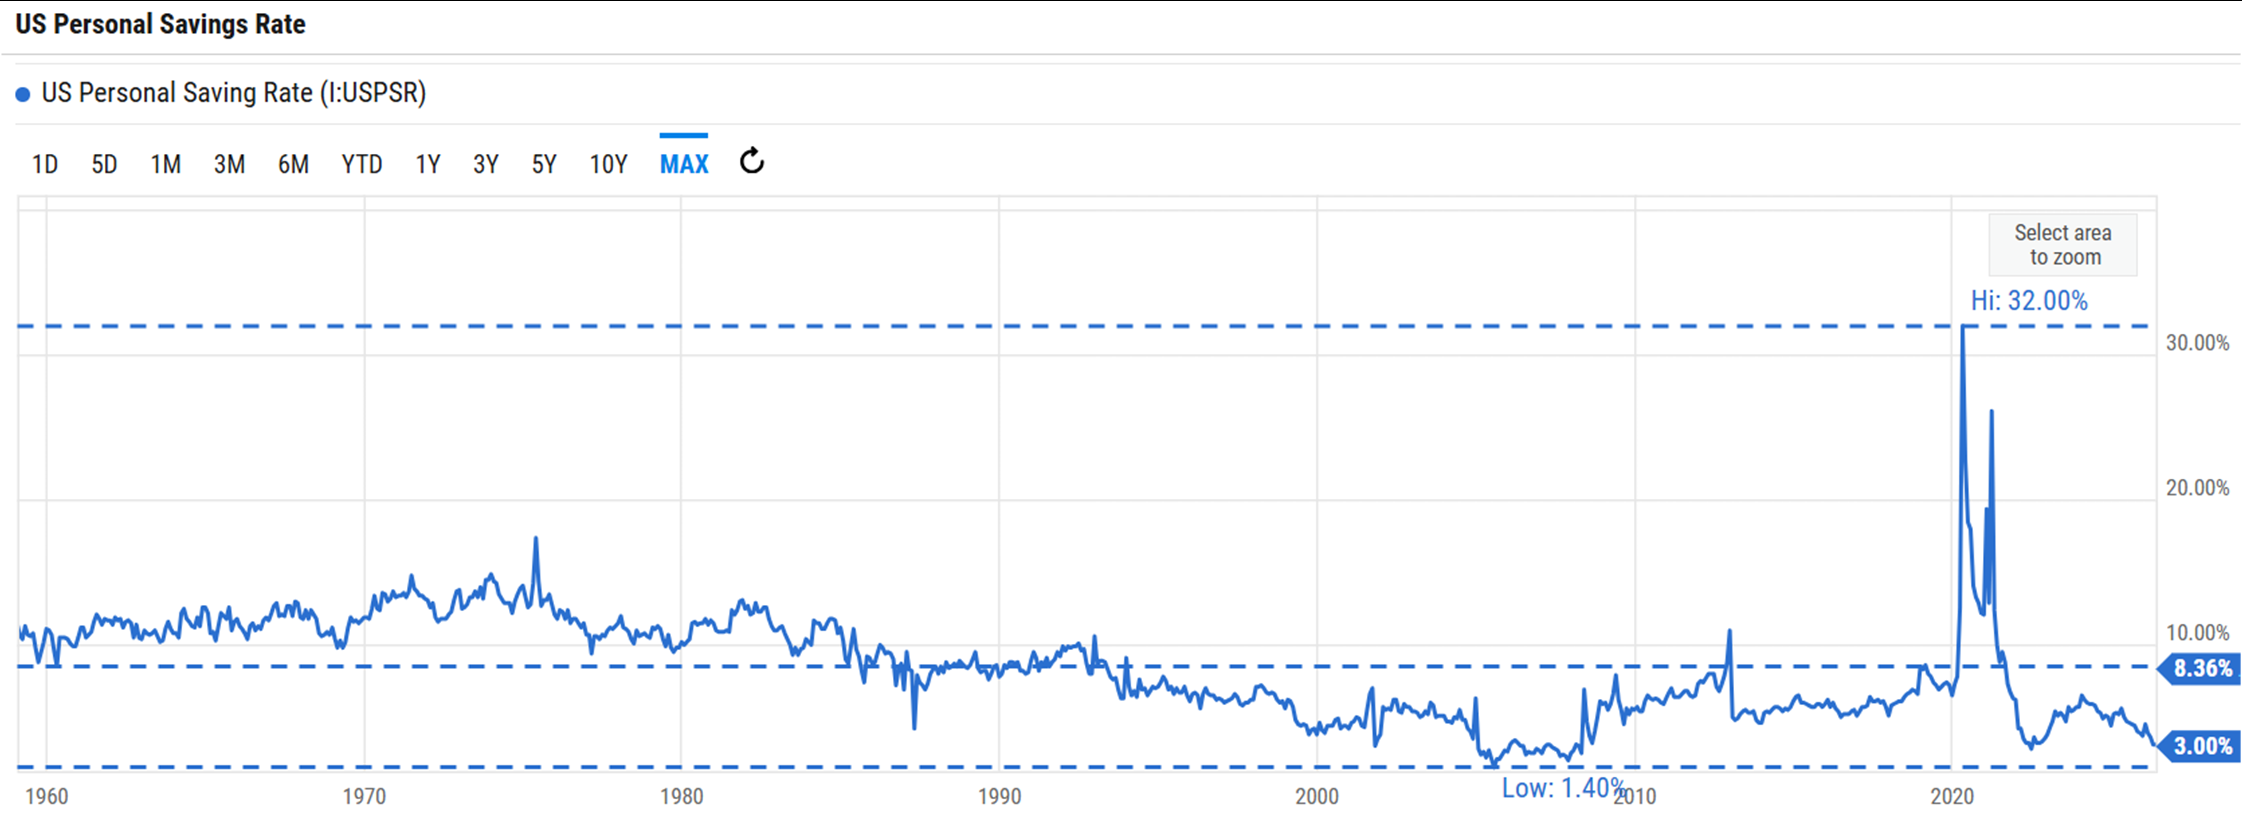
US Personal Savings Rate, long-term view. Source: YCharts.
Disclosure
Securities offered through Raymond James Financial Services, Inc. Member FINRA/SIPC. Any opinions are those of the author and not necessarily those of Raymond James. All opinions are as of this date and are subject to change without notice. The foregoing information has been obtained from sources considered to be reliable, but we do not guarantee that it is accurate or complete, it is not a statement of all available data necessary for making an investment decision, and it does not constitute a recommendation. Investing involves risk and you may incur a profit or loss regardless of strategy selected, including asset allocation and diversification. Past performance is not a guarantee of future results. References to portfolio positioning, investment committee decisions, asset allocation, or investment strategies are intended to provide insight into the firm's investment management process. Actual investment decisions and portfolio allocations vary based on each client's investment objectives, risk tolerance, financial circumstances, tax considerations, and other relevant factors. The S&P 500 is an unmanaged index of 500 widely held stocks that is generally considered representative of the U.S. stock market. The MSCI EAFE (Europe, Australasia, and Far East) Index is an equity index designed to measure the performance of developed markets outside of the U.S. and Canada. It includes countries in Europe, Asia, and the Pacific region. The NASDAQ Composite Index tracks the performance of more than 3,000 stocks listed on the NASDAQ Stock Market. The Dow Jones Industrial Average (DJIA) is a price-weighted index of 30 large, publicly owned U.S. companies. The Russell 2000 Index measures the performance of the 2,000 smallest companies in the Russell 3000 Index. The Bloomberg U.S. Aggregate Bond Index is a broad-based benchmark that measures the performance of the U.S. investment-grade bond market. The Bloomberg Municipal Bond Index tracks the performance of the U.S. investment-grade, tax-exempt bond market. It includes state and local general obligation bonds, revenue bonds, and pre-refunded bonds. Keep in mind that individuals cannot invest directly in any index, and index performance does not include transaction costs or other fees, which will affect actual investment performance. Individual investor's results will vary. Raymond James and its advisors do not offer tax or legal advice. You should discuss any tax or legal matters with the appropriate professional.